Is Kennewick, WA Tap Water Safe to Drink?
Kennewick tap water is legally compliant, but one contaminant exceeds health guidelines. Specifically: PFAS above EPA limits (PFOA: 4.45 ppt, PFOS: 9.98 ppt — limit is 4 ppt each). A point-of-use filter is recommended for drinking and cooking water.
Hardness Scale: Where Kennewick Falls
0Slightly
60Moderate
120Hard
180Very Hard
250Extreme
400+
How Kennewick Compares
Kennewick's water is 31% softer than the national average of 138 PPM - ranking in the bottom 57% for hardness nationwide. Most homes here do not need a softener. Within Washington, Kennewick has the 3rd hardest water out of 26 cities - 188% above the state average of 33 PPM. Among mid-size cities (100k-200k), Kennewick ranks #113 of 189 for hardness.
What Kennewick's Water Means for Your Home
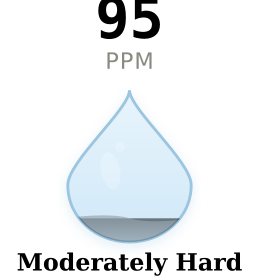
Hardness: 95 PPM - Low Concern
Kennewick's water is moderately hard at 95 PPM. You'll see some spotting on glassware and a film on shower doors over time, but it's not the kind of hardness that demands a full softener. A salt-free conditioner is worth considering if you have a tankless water heater or high-end fixtures.
Contaminants & Safety
Forever chemicals (PFAS) are worth watching here. Kennewick has PFOA at 4.45 ppt and PFOS at 9.98 ppt, exceeding the EPA's 2024 limit of 4 ppt per compound. PFAS are synthetic compounds that accumulate in your body over time. A certified carbon filter or reverse osmosis system with NSF P473 certification is the most effective protection. See the regulatory timeline.
What's in the Treatment Process
Kennewick's surface water supply requires heavy chlorination to stay safe — but that creates a tradeoff. The treatment process generates disinfection byproducts: TTHMs at 34 ppb (43% of the legal limit, but 226x the EWG guideline) and HAA5 at 11.7 ppb (19% of the legal limit, but 117x the EWG guideline). These are within legal limits, but the EWG sets much tighter thresholds based on cancer-risk research. A whole-house activated carbon filter reduces both chlorine and byproducts.
Chromium-6 was detected at 0.342 ppb, which is 17x the EWG health guideline. There's no separate federal limit for chromium-6, only total chromium. A reverse osmosis system is the most effective removal method. All measurements are within federal legal limits. The EWG guidelines represent a more conservative, health-based standard.
| Contaminant | Detected | Health Guideline | Legal Limit | Status |
|---|---|---|---|---|
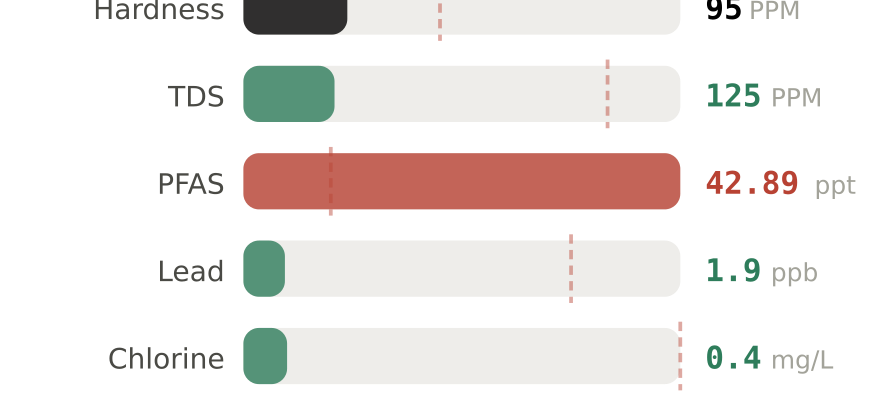
| Hardness (as CaCO₃) | 95 PPM | < 60 PPM | No federal limit | ✓ OK |
| Total Dissolved Solids | 125 PPM | < 300 PPM | 500 PPM | ✓ OK |
| PFAS (total) | 42.89 ppt | — | No total limit | Detected |
| ↳ PFOA | 4.45 ppt | 0 ppt | 4 ppt (2024) | ⚠ Exceeds |
| ↳ PFOS | 9.98 ppt | 0 ppt | 4 ppt (2024) | ⚠ Exceeds |
| Lead | 1.9 ppb | 0 ppb (no safe level) | 15 ppb (10 ppb in 2027) | ✓ Low |
| Chlorine / Chloramine | 0.4 mg/L | Taste threshold ~1.0 | 4.0 mg/L | ✓ Normal |
| Nitrate | 1.83 mg/L | 5 mg/L | 10 mg/L | ✓ OK |
Recommendations for Kennewick Homes
Recommended Filter for Kennewick
PFAS exceed EPA limits (PFOA: 4.45 ppt, PFOS: 9.98 ppt — limit: 4 ppt each). A certified filter reduces these contaminants effectively.
How to Test Your Water in Kennewick
With PFAS at 42.89 ppt in Kennewick's supply, confirming your home's specific levels is especially important. PFAS vary by neighborhood and can concentrate differently depending on your position in the distribution system.
Free option: Request City of Kennewick Water's annual Consumer Confidence Report for official city-level data.
📊 Already Tested Your Water?
City averages miss neighborhood-level variation. Share your results to help your neighbors get better data.
We review every submission before publishing. Your ZIP is shown; your identity is not.
About Kennewick's Water Supply
Water Utility: City of Kennewick Water
Water Source: Columbia River (Surface Water)
Population Served: 114,468
Hardness: 95 PPM (5.6 grains per gallon)
Kennewick's drinking water comes from surface sources — Columbia River. Surface water requires more extensive treatment than groundwater, including coagulation, filtration, and disinfection. This heavier chlorination is why disinfection byproducts tend to be higher in surface-supplied systems. On the upside, surface sources often deliver softer water than deep aquifers. The system serves 114,000 residents.
Water quality can vary by neighborhood and season. For your exact numbers, request City of Kennewick Water's Consumer Confidence Report (CCR) or test your own tap.
ZIP Codes Covered by This Report
This water quality data applies to all areas served by City of Kennewick Water in Kennewick, WA, including ZIP codes:
99336, 99337, 99338
If your ZIP code is listed above, this report covers your water supply. Water quality may vary slightly by neighborhood.
Compare Kennewick to Other Washington Cities
Frequently Asked Questions About Kennewick Water
Is Kennewick tap water safe to drink?
Where does Kennewick's water come from?
Do I need a water softener in Kennewick?
How do I remove PFAS from Kennewick tap water?
What water filter is best for Kennewick?
Is Kennewick water safe for babies and infants?
What is the hardness of Kennewick water in grains per gallon?
What are disinfection byproducts in Kennewick's water?
Data sources: Lead and copper data from EPA Safe Drinking Water Act LCR reporting. Contaminant data from utility-reported testing results. PFAS data from EPA UCMR5 (2023–2025). Hardness from USGS and municipal reports. Data reflects system-level testing results and may not match your specific tap due to neighborhood plumbing, season, or recent utility changes. For your utility's latest results, request their Consumer Confidence Report (CCR). Our methodology. Last updated: 2026-02-24.
What Kennewick Homeowners Actually Buy
Prioritized for contaminant reduction for homes with 95 PPM water and PFAS above EPA limits.
Affiliate disclosure: we may earn a commission. Selection based on Kennewick's water data.