Is Richmond, VA Tap Water Safe to Drink?
Yes, Richmond tap water is safe to drink. Hardness is low at 70 PPM, and no contaminants exceed health guidelines. Most homes here don't need treatment.
Hardness Scale: Where Richmond Falls
0Slightly
60Moderate
120Hard
180Very Hard
250Extreme
400+
How Richmond Compares
Richmond's water is 49% softer than the national average of 138 PPM - ranking in the bottom 63% for hardness nationwide. Most homes here do not need a softener. Within Virginia, it ranks #6 of 22 cities (37% above the state average of 51 PPM). Among large cities (200k-500k), Richmond ranks #104 of 165 for hardness.
What Richmond's Water Means for Your Home
Hardness: 70 PPM - Low Concern
Richmond's water is moderately hard at 70 PPM. You'll see some spotting on glassware and a film on shower doors over time, but it's not the kind of hardness that demands a full softener. A salt-free conditioner is worth considering if you have a tankless water heater or high-end fixtures.
Contaminants & Safety
Disinfection byproducts are the notable finding here. Richmond's water has TTHMs at 26.9 ppb and HAA5 at 20.5 ppb — both within legal limits, but the EWG health guidelines are far stricter. These byproducts form when chlorine reacts with organic matter during treatment. A whole-house activated carbon filter reduces both chlorine and its byproducts. Want the full picture? Request your utility's annual Consumer Confidence Report.
What's in the Treatment Process
Richmond's surface water supply requires heavy chlorination to stay safe — but that creates a tradeoff. The treatment process generates disinfection byproducts: TTHMs at 26.9 ppb (34% of the legal limit, but 179x the EWG guideline) and HAA5 at 20.5 ppb (34% of the legal limit, but 205x the EWG guideline). These are within legal limits, but the EWG sets much tighter thresholds based on cancer-risk research. A whole-house activated carbon filter reduces both chlorine and byproducts.
Chromium-6 was detected at 0.298 ppb, which is 15x the EWG health guideline. There's no separate federal limit for chromium-6, only total chromium. A reverse osmosis system is the most effective removal method. All measurements are within federal legal limits. The EWG guidelines represent a more conservative, health-based standard.
| Contaminant | Detected | Health Guideline | Legal Limit | Status |
|---|---|---|---|---|
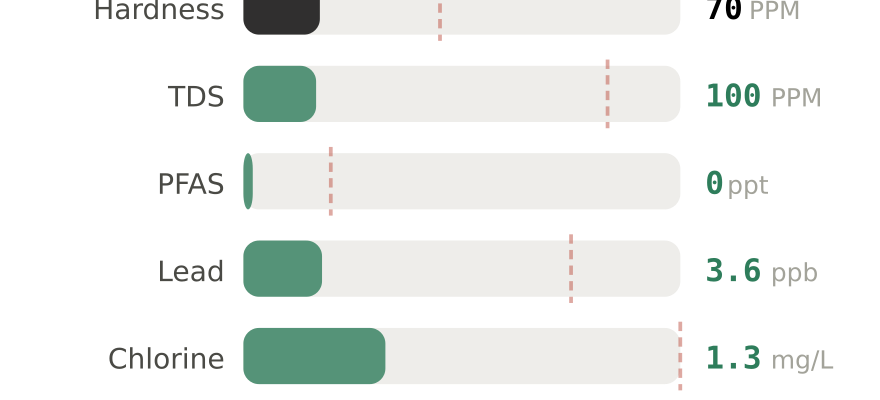
| Hardness (as CaCO₃) | 70 PPM | < 60 PPM | No federal limit | ✓ OK |
| Total Dissolved Solids | 100 PPM | < 300 PPM | 500 PPM | ✓ OK |
| PFAS (total) | 0 ppt | — | No total limit | ✓ ND |
| ↳ PFOA | 0 ppt | 0 ppt | 4 ppt (2024) | ✓ OK |
| ↳ PFOS | 0 ppt | 0 ppt | 4 ppt (2024) | ✓ OK |
| Lead | 3.6 ppb | 0 ppb (no safe level) | 15 ppb (10 ppb in 2027) | ✓ Low |
| Chlorine / Chloramine | 1.3 mg/L | Taste threshold ~1.0 | 4.0 mg/L | ✓ Normal |
| Nitrate | 0.12 mg/L | 5 mg/L | 10 mg/L | ✓ OK |
Recommendations for Richmond Homes
Quick Fix for Chlorine: Shower Filter
At 1.3 mg/L chlorine, many Richmond residents notice dry skin, brittle hair, and that "pool smell" in the shower. A shower filter installs in 5 minutes, no tools needed.
How to Test Your Water in Richmond
City-wide data is a solid starting point, but your specific tap might differ based on plumbing age, distance from the treatment plant, or seasonal changes.
Free option: Request Richmond DPU's annual Consumer Confidence Report for official city-level data.
📊 Already Tested Your Water?
City averages miss neighborhood-level variation. Share your results to help your neighbors get better data.
We review every submission before publishing. Your ZIP is shown; your identity is not.
About Richmond's Water Supply
Water Utility: Richmond DPU
Water Source: James River (Surface Water)
Population Served: 229,395
Hardness: 70 PPM (4.1 grains per gallon)
Richmond's drinking water comes from surface sources — James River. Surface water requires more extensive treatment than groundwater, including coagulation, filtration, and disinfection. This heavier chlorination is why disinfection byproducts tend to be higher in surface-supplied systems. On the upside, surface sources often deliver softer water than deep aquifers. The system serves 229,000 residents.
Water quality can vary by neighborhood and season. For your exact numbers, request Richmond DPU's Consumer Confidence Report (CCR) or test your own tap.
ZIP Codes Covered by This Report
This water quality data applies to all areas served by Richmond DPU in Richmond, VA, including ZIP codes:
22546, 23002, 23005, 23014, 23015, 23024, 23027, 23039, 23040, 23047, 23059, 23060, 23063, 23065, 23067, 23083, 23102, 23103, 23105, 23112, 23113, 23114, 23120, 23129, 23139, 23146, 23153, 23160, 23173, 23192, 23218, 23219, 23220, 23221, 23222, 23223, 23224, 23225, 23226, 23227, 23230, 23232, 23234, 23235, 23236, 23237, 23241, 23249, 23250, 23260, 23261, 23269, 23273, 23274, 23276, 23278, 23279, 23282, 23284, 23285, 23286, 23289, 23290, 23291, 23292, 23293, 23294, 23295, 23297, 23298, 23821, 23822, 23824, 23832, 23833, 23838, 23840, 23843, 23850, 23856, 23868, 23872, 23873, 23876, 23885, 23889, 23894, 23922, 23930, 23938, 23944, 23955
If your ZIP code is listed above, this report covers your water supply. Water quality may vary slightly by neighborhood.
Compare Richmond to Other Virginia Cities
Frequently Asked Questions About Richmond Water
Is Richmond tap water safe to drink?
Where does Richmond's water come from?
Do I need a water softener in Richmond?
What is the hardness of Richmond water in grains per gallon?
What are disinfection byproducts in Richmond's water?
Is chromium-6 in Richmond's water?
Why does Richmond water taste like chlorine?
Can I drink Richmond tap water straight from the faucet?
Data sources: Lead and copper data from EPA Safe Drinking Water Act LCR reporting. Contaminant data from utility-reported testing results. PFAS data from EPA UCMR5 (2023–2025). Hardness from USGS and municipal reports. Data reflects system-level testing results and may not match your specific tap due to neighborhood plumbing, season, or recent utility changes. For your utility's latest results, request their Consumer Confidence Report (CCR). Our methodology. Last updated: 2026-02-24.
What Richmond Homeowners Actually Buy
Common purchases for homes with 70 PPM water.
Affiliate disclosure: we may earn a commission. Selection based on Richmond's water data.