Is South Burlington, VT Tap Water Safe to Drink?
No health-based violations or limit exceedances in recent EPA data for South Burlington's water system. This covers EPA violation records since November 2023, the latest lead testing, and EPA's PFAS testing. Your home's own plumbing can still add lead, so a tap test is how to be sure.
EPA health violations for South Burlington City Water System
No health-based violations (exceeding a contaminant or disinfectant limit, or missing a required treatment step) reported to EPA for South Burlington City Water System since November 2023.
Source: EPA Safe Drinking Water Information System (SDWIS) via ECHO, data as of October 14, 2026, EPA system ID VT0005091. Covers health-based violations since November 2023; monitoring and reporting violations are not shown. Look up the system on EPA ECHO.
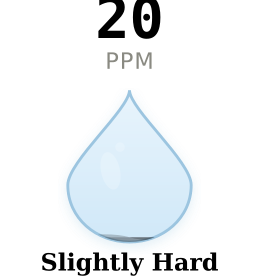
Hardness Scale: Where South Burlington Falls
0Slightly
17Moderate
60Hard
120Very Hard
180Extreme
250+
How South Burlington Compares
South Burlington's water is 85% softer than the national average of 136 PPM - ranking in the bottom 92% for hardness nationwide. Most homes here do not need a softener. Within Vermont, South Burlington has the 3rd hardest water out of 5 cities - 0% below the state average of 20 PPM. Among smaller cities, South Burlington ranks #210 of 244 for hardness.
What South Burlington's Water Means for Your Home
Hardness: 20 PPM - Low Concern
South Burlington's water is slightly hard at 20 PPM. Most households won't notice any issues at this level. Scale buildup is minimal, and a water softener would be overkill. South Burlington is softer than 92% of US cities. If you're thinking about water treatment, contaminant filtration is where to focus your money, not softening.
Contaminants & Safety
Disinfection byproducts are the notable finding here. South Burlington's water has TTHMs at 27.4 ppb and HAA5 at 21.6 ppb — below the legal limits in EWG's data, and the EWG health guidelines are far stricter. These byproducts form when chlorine reacts with organic matter during treatment. A whole-house activated carbon filter reduces both chlorine and its byproducts. Want the full picture? Request your utility's annual Consumer Confidence Report.
What's in the Treatment Process
South Burlington's surface water supply requires heavy chlorination to stay safe — but that creates a tradeoff. The treatment process generates disinfection byproducts: TTHMs at 27.4 ppb (34% of the legal limit, but 183x the EWG guideline) and HAA5 at 21.6 ppb (36% of the legal limit, but 216x the EWG guideline). These EWG-reported values are below the legal limits, and the EWG sets much tighter thresholds based on cancer-risk research. A whole-house activated carbon filter reduces both chlorine and byproducts.
Chromium-6 was detected at 0.0475 ppb, which is 2.4x the EWG health guideline. There's no separate federal limit for chromium-6, only total chromium. A reverse osmosis system is the most effective removal method. The EWG guidelines represent a more conservative, health-based standard than federal legal limits.
| Measure | Result | Guideline | Legal Limit | Status |
|---|---|---|---|---|
| PFOA (highest entry-point avg.) | ND (< 4 ppt) | 0 ppt (EPA goal) | 4 ppt (from 2029) | ✓ Below |
| PFOS (highest entry-point avg.) | ND (< 4 ppt) | 0 ppt (EPA goal) | 4 ppt (from 2029) | ✓ Below |
| ↳ Total PFAS (average of all samples) | None detected (EPA reporting limits 3–20 ppt) | — | No total limit | Not detected |
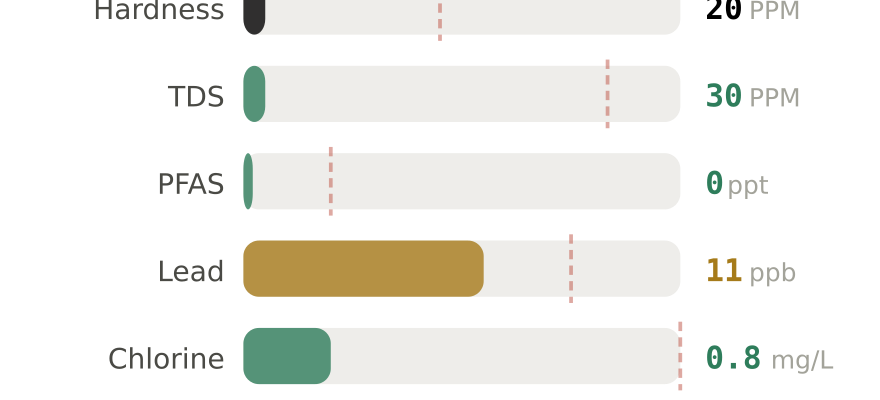
| Lead (90th percentile, Dec 2027) | 0 ppb | 0 ppb (no safe level) | Action level 15 ppb (10 ppb from Nov 2027) | ✓ Low |
| Nitrate (EWG data) | 0.0733 mg/L | 5 mg/L (CheckMyTap flag, half the limit) | 10 mg/L | ✓ OK |
| Hardness (estimate) | ~20 PPM | Not a health issue | No federal limit | OK |
| Total Dissolved Solids (estimate) | ~30 PPM | 500 PPM (taste, not enforceable) | No federal limit | OK |
| Chlorine / Chloramine (estimate) | ~0.8 mg/L | Taste threshold ~1.0 | 4.0 mg/L | Normal |
Lithium (EPA testing, Jul 2023–Apr 2024)
Average across 4 samples: 0 µg/L. Highest single result: 0 µg/L. 0 of 4 samples were above 10 µg/L, EPA's Health Reference Level: a non-regulatory screening value, not a legal limit. Lithium has no federal drinking water limit, and EPA says the health risk at these levels is uncertain. Boiling does not remove it. In EPA's study of treatment plants, reverse osmosis removed more than 90% and ion exchange was inconsistent; we found no home filter certified for lithium reduction. What the lithium results mean
Good news for South Burlington residents. Your water quality is generally good. Most homes in this area do not need a water softener. If you have concerns about lead (especially in buildings constructed before 1986) or chlorine taste, a point-of-use filter is the most practical and cost-effective solution.
How to Test Your Water in South Burlington
City-wide data is a solid starting point, but your specific tap might differ based on plumbing age, distance from the treatment plant, or seasonal changes.
Free option: Request Champlain Water District's annual Consumer Confidence Report for official city-level data.
📊 Already Tested Your Water?
City averages miss neighborhood-level variation. Share your results to help your neighbors get better data.
We review every submission before publishing. Your ZIP is shown; your identity is not.
About South Burlington's Water Supply
Water Utility: Champlain Water District
Water Source: Lake Champlain (Surface Water)
Population Served: 19,500
Hardness: 20 PPM (1.2 grains per gallon)
South Burlington's drinking water comes from surface sources — Lake Champlain. Surface water requires more extensive treatment than groundwater, including coagulation, filtration, and disinfection. This heavier chlorination is why disinfection byproducts tend to be higher in surface-supplied systems. On the upside, surface sources often deliver softer water than deep aquifers. The system serves 20,000 residents.
Water quality can vary by neighborhood and season. For your exact numbers, request Champlain Water District's Consumer Confidence Report (CCR) or test your own tap.
ZIP Codes In and Near South Burlington
This report is for the water system serving South Burlington, VT (Champlain Water District). ZIP codes in and near this area:
05403, 05407, 05443, 05445, 05456, 05461, 05462, 05469, 05472, 05473, 05482, 05487, 05491, 05495
A ZIP code can be served by more than one water system. Confirm your utility on your water bill or your utility's Consumer Confidence Report.
Compare South Burlington to Other Vermont Cities
Frequently Asked Questions About South Burlington Water
Is South Burlington tap water safe to drink?
Where does South Burlington's water come from?
Do I need a water softener in South Burlington?
What are disinfection byproducts in South Burlington's water?
Is chromium-6 in South Burlington's water?
Can I drink South Burlington tap water straight from the faucet?
What water filter is best for South Burlington?
Data sources: Water system, health-based violations, and lead (90th percentile) from the EPA Safe Drinking Water Information System via ECHO (data as of October 14, 2026). PFAS and lithium from EPA's final UCMR 5 dataset (sampling 2023 to 2025, released August 2026). Disinfection byproducts, chromium-6, nitrate, and other contaminant values and health-guideline comparisons are from the Environmental Working Group (EWG) Tap Water Database (data as of Feb 2026); EWG health guidelines are stricter than legal limits and are not EPA standards. Hardness, TDS, and chlorine are estimates, not utility measurements. Results describe the water system, not your tap: lead in particular depends on your home's plumbing. For your utility's latest results, request its Consumer Confidence Report (CCR). Our methodology · Report a data error. Page data refreshed 2026-11-01.