Is Woodburn, OR Tap Water Safe to Drink?
Yes, Woodburn tap water is safe to drink. Hardness is low at 30 PPM, and no contaminants exceed health guidelines. Most homes here don't need treatment.
Hardness Scale: Where Woodburn Falls
0Slightly
60Moderate
120Hard
180Very Hard
250Extreme
400+
How Woodburn Compares
Woodburn's water is 78% softer than the national average of 138 PPM - ranking in the bottom 83% for hardness nationwide. Most homes here do not need a softener. Within Oregon, it ranks #10 of 48 cities (20% above the state average of 25 PPM). Among smaller cities, Woodburn ranks #215 of 288 for hardness.
What Woodburn's Water Means for Your Home
Hardness: 30 PPM - Low Concern
Woodburn's water is slightly hard at 30 PPM. Most households won't notice any issues at this level. Scale buildup is minimal, and a water softener would be overkill. Woodburn is softer than 83% of US cities. If you're thinking about water treatment, contaminant filtration is where to focus your money, not softening.
Contaminants & Safety
Lead levels deserve attention. At 7.5 ppb, Woodburn is above the ideal of zero, though below the EPA action level of 15 ppb (dropping to 10 ppb in November 2027 under the Lead and Copper Rule Improvements). The lead typically comes from aging service lines or interior plumbing, not the treatment plant. A point-of-use filter certified for lead at the kitchen faucet is a practical safeguard, especially in older homes.
| Contaminant | Detected | Health Guideline | Legal Limit | Status |
|---|---|---|---|---|
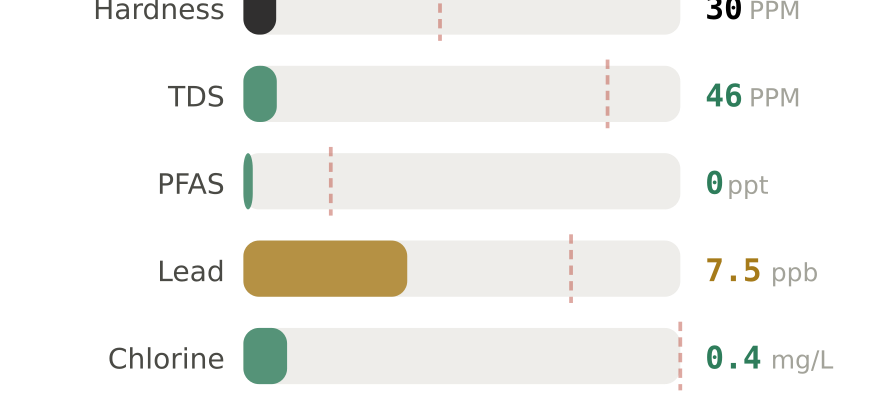
| Hardness (as CaCO₃) | 30 PPM | < 60 PPM | No federal limit | ✓ OK |
| Total Dissolved Solids | 46 PPM | < 300 PPM | 500 PPM | ✓ OK |
| PFAS (total) | 0 ppt | — | No total limit | ✓ ND |
| ↳ PFOA | 0 ppt | 0 ppt | 4 ppt (2024) | ✓ OK |
| ↳ PFOS | 0 ppt | 0 ppt | 4 ppt (2024) | ✓ OK |
| Lead | 7.5 ppb | 0 ppb (no safe level) | 15 ppb (10 ppb in 2027) | ⚠ Elevated |
| Chlorine / Chloramine | 0.4 mg/L | Taste threshold ~1.0 | 4.0 mg/L | ✓ Normal |
| Nitrate | 0.0144 mg/L | 5 mg/L | 10 mg/L | ✓ OK |
How to Test Your Water in Woodburn
Lead enters water from your home's plumbing, not the treatment plant — so Woodburn's city-wide average of 7.5 ppb may not match your tap. Testing your specific faucet is the only way to know. Run cold water for 30 seconds before collecting a sample.
Free option: Request City of Woodburn Water's annual Consumer Confidence Report for official city-level data.
📊 Already Tested Your Water?
City averages miss neighborhood-level variation. Share your results to help your neighbors get better data.
We review every submission before publishing. Your ZIP is shown; your identity is not.
About Woodburn's Water Supply
Water Utility: City of Woodburn Water
Water Source: local wells (Groundwater)
Population Served: 29,455
Hardness: 30 PPM (1.8 grains per gallon)
Woodburn draws its drinking water from groundwater sources — local wells. Groundwater typically requires less treatment than surface water because the earth acts as a natural filter. The tradeoff: dissolved minerals from underground rock formations, which is why mineral content varies by aquifer depth and geology. The geological profile determines hardness, iron, and trace mineral levels. The system serves 29,000 residents.
Water quality can vary by neighborhood and season. For your exact numbers, request City of Woodburn Water's Consumer Confidence Report (CCR) or test your own tap.
ZIP Codes Covered by This Report
This water quality data applies to all areas served by City of Woodburn Water in Woodburn, OR, including ZIP codes:
97020, 97026, 97032, 97071, 97137
If your ZIP code is listed above, this report covers your water supply. Water quality may vary slightly by neighborhood.
Compare Woodburn to Other Oregon Cities
Frequently Asked Questions About Woodburn Water
Is Woodburn tap water safe to drink?
Where does Woodburn's water come from?
Do I need a water softener in Woodburn?
What water filter is best for Woodburn?
Is Woodburn water safe for babies and infants?
Can I drink Woodburn tap water straight from the faucet?
Data sources: Lead and copper data from EPA Safe Drinking Water Act LCR reporting. Contaminant data from utility-reported testing results. PFAS data from EPA UCMR5 (2023–2025). Hardness from USGS and municipal reports. Data reflects system-level testing results and may not match your specific tap due to neighborhood plumbing, season, or recent utility changes. For your utility's latest results, request their Consumer Confidence Report (CCR). Our methodology. Last updated: 2026-02-24.
What Woodburn Homeowners Actually Buy
Common purchases for homes with 30 PPM water.
Affiliate disclosure: we may earn a commission. Selection based on Woodburn's water data.