Is Boston, MA Tap Water Safe to Drink?
Yes, Boston tap water is safe to drink. Hardness is low at 15 PPM, and no contaminants exceed health guidelines. Most homes here don't need treatment.
Hardness Scale: Where Boston Falls
0Slightly
60Moderate
120Hard
180Very Hard
250Extreme
400+
How Boston Compares
Boston's water is 89% softer than the national average of 138 PPM - ranking in the bottom 96% for hardness nationwide. Most homes here do not need a softener. Within Massachusetts, it ranks #10 of 21 cities (21% below the state average of 19 PPM). Among major US cities (500k+), Boston ranks #99 of 100 for hardness.
What Boston's Water Means for Your Home
Hardness: 15 PPM - Low Concern
Boston's water is soft at just 15 PPM. That's good news for your plumbing, appliances, and skin. Scale buildup is a non-issue here, and a water softener would be a waste of money. Boston is softer than 96% of US cities. If you're thinking about water treatment in Boston, contaminant filtration is the place to invest.
Contaminants & Safety
Lead levels deserve attention. At 5.9 ppb, Boston is above the ideal of zero, though below the EPA action level of 15 ppb (dropping to 10 ppb in November 2027 under the Lead and Copper Rule Improvements). The lead typically comes from aging service lines or interior plumbing, not the treatment plant. A point-of-use filter certified for lead at the kitchen faucet is a practical safeguard, especially in older homes.
What's in the Treatment Process
Boston's surface water supply requires heavy chlorination to stay safe — but that creates a tradeoff. The treatment process generates disinfection byproducts: TTHMs at 17.2 ppb (22% of the legal limit, but 115x the EWG guideline) and HAA5 at 14.7 ppb (25% of the legal limit, but 147x the EWG guideline). These are within legal limits, but the EWG sets much tighter thresholds based on cancer-risk research. A whole-house activated carbon filter reduces both chlorine and byproducts. All measurements are within federal legal limits. The EWG guidelines represent a more conservative, health-based standard.
| Contaminant | Detected | Health Guideline | Legal Limit | Status |
|---|---|---|---|---|
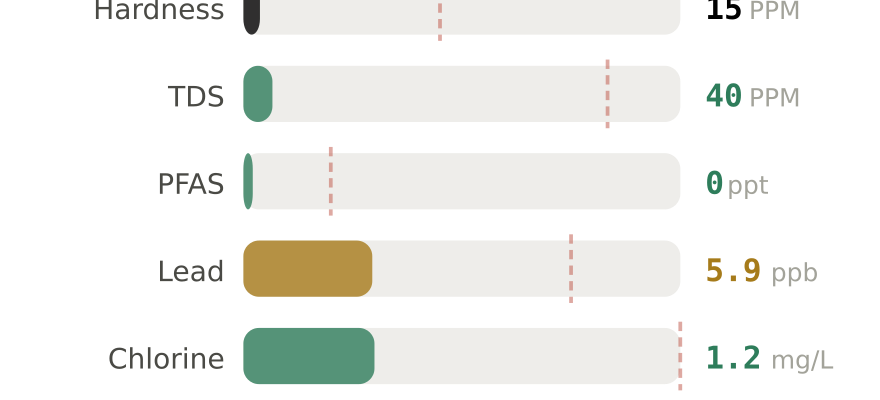
| Hardness (as CaCO₃) | 15 PPM | < 60 PPM | No federal limit | ✓ OK |
| Total Dissolved Solids | 40 PPM | < 300 PPM | 500 PPM | ✓ OK |
| PFAS (total) | Not tested | — | No total limit | N/A |
| Lead | 5.9 ppb | 0 ppb (no safe level) | 15 ppb (10 ppb in 2027) | ⚠ Elevated |
| Chlorine / Chloramine | 1.2 mg/L | Taste threshold ~1.0 | 4.0 mg/L | ✓ Normal |
| Nitrate | 0.141 mg/L | 5 mg/L | 10 mg/L | ✓ OK |
Quick Fix for Chlorine: Shower Filter
At 1.2 mg/L chlorine, many Boston residents notice dry skin, brittle hair, and that "pool smell" in the shower. A shower filter installs in 5 minutes, no tools needed.
How to Test Your Water in Boston
Lead enters water from your home's plumbing, not the treatment plant — so Boston's city-wide average of 5.9 ppb may not match your tap. Testing your specific faucet is the only way to know. Run cold water for 30 seconds before collecting a sample.
Free option: Request BWSC's annual Consumer Confidence Report for official city-level data.
📊 Already Tested Your Water?
City averages miss neighborhood-level variation. Share your results to help your neighbors get better data.
We review every submission before publishing. Your ZIP is shown; your identity is not.
About Boston's Water Supply
Water Utility: BWSC
Water Source: Quabbin + Wachusett Reservoirs (Surface Water)
Population Served: 2,660,000
Hardness: 15 PPM (0.9 grains per gallon)
Boston's drinking water comes from surface sources — Quabbin + Wachusett Reservoirs. Surface water requires more extensive treatment than groundwater, including coagulation, filtration, and disinfection. This heavier chlorination is why disinfection byproducts tend to be higher in surface-supplied systems. On the upside, surface sources often deliver softer water than deep aquifers. The system serves 2.7 million residents.
Water quality can vary by neighborhood and season. For your exact numbers, request BWSC's Consumer Confidence Report (CCR) or test your own tap.
ZIP Codes Covered by This Report
This water quality data applies to all areas served by BWSC in Boston, MA, including ZIP codes:
02108, 02109, 02110, 02111, 02112, 02113, 02114, 02115, 02116, 02117, 02118, 02119, 02120, 02121, 02122, 02123, 02124, 02125, 02127, 02128, 02129, 02133, 02163, 02196, 02199, 02201, 02203, 02204, 02205, 02206, 02210, 02211, 02212, 02215, 02217, 02222, 02241, 02266, 02283, 02284, 02293, 02297, 02298
If your ZIP code is listed above, this report covers your water supply. Water quality may vary slightly by neighborhood.
Compare Boston to Other Massachusetts Cities
Frequently Asked Questions About Boston Water
Is Boston tap water safe to drink?
Where does Boston's water come from?
Do I need a water softener in Boston?
What water filter is best for Boston?
Is Boston water safe for babies and infants?
What are disinfection byproducts in Boston's water?
Why does Boston water taste like chlorine?
Can I drink Boston tap water straight from the faucet?
Data sources: Lead and copper data from EPA Safe Drinking Water Act LCR reporting. Contaminant data from utility-reported testing results. PFAS data from EPA UCMR5 (2023–2025). Hardness from USGS and municipal reports. Data reflects system-level testing results and may not match your specific tap due to neighborhood plumbing, season, or recent utility changes. For your utility's latest results, request their Consumer Confidence Report (CCR). Our methodology. Last updated: 2026-02-24.
What Boston Homeowners Actually Buy
Common purchases for homes with 15 PPM water.
Affiliate disclosure: we may earn a commission. Selection based on Boston's water data.