Is San Bernardino, CA Tap Water Safe to Drink?
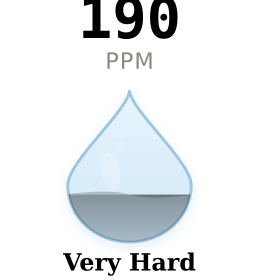
Yes, San Bernardino tap water is safe to drink. No contaminants exceed health guidelines. However, San Bernardino has very hard water at 190 PPM, which will cause scale buildup in plumbing and appliances over time. A water softener is worth considering.
Hardness Scale: Where San Bernardino Falls
0Slightly
60Moderate
120Hard
180Very Hard
250Extreme
400+
How San Bernardino Compares
San Bernardino's water is 38% harder than the national average of 138 PPM. It ranks #343 out of 1000 cities in our database (harder than 66% of US cities we track). Within California, it ranks #44 of 87 cities (6% above the state average of 180 PPM). Among large cities (200k-500k), San Bernardino ranks #52 of 165 for hardness. At this hardness level, water heaters run an estimated 35% less efficiently due to scale insulation, and major water-using appliances typically last 3 years less than the national average lifespan.
What San Bernardino's Water Means for Your Home
Hardness: 190 PPM - Treatment Recommended
San Bernardino has some seriously hard water. At 190 PPM (11.1 grains per gallon), your tap is loaded with dissolved calcium and magnesium picked up from underground limestone and dolomite formations. Here's the thing: it's perfectly safe to drink. The minerals won't hurt you. But they will hurt your wallet. That adds up. Hard water at 190 PPM increases household costs through scale-coated water heaters that use more energy, extra soap and detergent, and appliances that wear out faster. Most San Bernardino homeowners don't realize it until the plumber shows up. That's 6% harder than the California average.
Contaminants & Safety
Lead levels deserve attention. At 5 ppb, San Bernardino is above the ideal of zero, though below the EPA action level of 15 ppb (dropping to 10 ppb in November 2027 under the Lead and Copper Rule Improvements). The lead typically comes from aging service lines or interior plumbing, not the treatment plant. A point-of-use filter certified for lead at the kitchen faucet is a practical safeguard, especially in older homes.
What's in the Treatment Process
Even though San Bernardino draws from groundwater, the treatment process still generates disinfection byproducts: TTHMs at 2.71 ppb and HAA5 at 36.2 ppb. Groundwater typically needs less treatment than surface water, but when organic compounds are present in the aquifer, chlorination creates the same byproducts. All levels are within legal limits, though above the stricter EWG health guidelines.
Chromium-6 is naturally present in San Bernardino's aquifer geology at 1.14 ppb — 57x the EWG health guideline. There's no federal legal limit for chromium-6 specifically (only total chromium), which is why EWG tracks it separately. All measurements are within federal legal limits. The EWG guidelines represent a more conservative, health-based standard.
How Hard Water Affects Your Home
At 190 PPM, untreated hard water has measurable effects on household costs and appliance life:
- Water heater inefficiency: Scale insulation forces the heater to work harder (DOE estimates up to 22% more energy for heavily scaled units)
- Soap and detergent: Hard water reduces lathering, requiring significantly more product
- Appliance replacement: Water heaters, dishwashers, and washing machines fail 2-4 years earlier due to scale buildup
- Plumbing maintenance: Scale buildup in pipes reduces flow and requires more frequent service
Note: Impact varies by household size, water usage, and local energy costs. A home water test provides the most accurate assessment for your specific situation.
| Contaminant | Detected | Health Guideline | Legal Limit | Status |
|---|---|---|---|---|
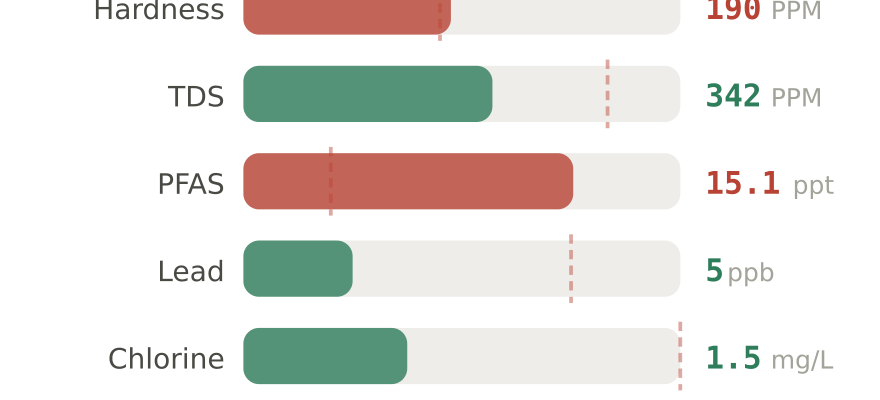
| Hardness (as CaCO₃) | 190 PPM | < 60 PPM | No federal limit | ⚠ Very Hard |
| Total Dissolved Solids | 342 PPM | < 300 PPM | 500 PPM | ⚠ Elevated |
| PFAS (total) | 15.1 ppt | — | No total limit | Detected |
| ↳ PFOA | 0 ppt | 0 ppt | 4 ppt (2024) | ✓ OK |
| ↳ PFOS | 0 ppt | 0 ppt | 4 ppt (2024) | ✓ OK |
| Lead | 5 ppb | 0 ppb (no safe level) | 15 ppb (10 ppb in 2027) | ✓ Low |
| Chlorine / Chloramine | 1.5 mg/L | Taste threshold ~1.0 | 4.0 mg/L | ✓ Normal |
| Nitrate | 4.23 mg/L | 5 mg/L | 10 mg/L | ✓ OK |
Recommendations for San Bernardino Homes
Our Top Picks for San Bernardino (190 PPM)
Hard water at 190 PPM causes scale buildup, increased energy use, and premature appliance failure. A softener protects your plumbing and appliances.
Quick Fix for Chlorine: Shower Filter
At 1.5 mg/L chlorine, many San Bernardino residents notice dry skin, brittle hair, and that "pool smell" in the shower. A shower filter installs in 5 minutes, no tools needed.
How to Test Your Water in San Bernardino
Lead enters water from your home's plumbing, not the treatment plant — so San Bernardino's city-wide average of 5 ppb may not match your tap. Testing your specific faucet is the only way to know. Run cold water for 30 seconds before collecting a sample.
Free option: Request San Bernardino MWD's annual Consumer Confidence Report for official city-level data.
📊 Already Tested Your Water?
City averages miss neighborhood-level variation. Share your results to help your neighbors get better data.
We review every submission before publishing. Your ZIP is shown; your identity is not.
About San Bernardino's Water Supply
Water Utility: San Bernardino MWD
Water Source: Groundwater, State Water Project (Groundwater)
Population Served: 214,665
Hardness: 190 PPM (11.1 grains per gallon)
San Bernardino draws its drinking water from groundwater sources — Groundwater, State Water Project. Groundwater typically requires less treatment than surface water because the earth acts as a natural filter. The tradeoff: dissolved minerals from underground rock formations, which is why hardness is elevated here. Calcium and magnesium dissolve into the water as it moves through limestone and dolomite. The system serves 215,000 residents.
Water quality can vary by neighborhood and season. For your exact numbers, request San Bernardino MWD's Consumer Confidence Report (CCR) or test your own tap.
ZIP Codes Covered by This Report
This water quality data applies to all areas served by San Bernardino MWD in San Bernardino, CA, including ZIP codes:
92268, 92285, 92301, 92305, 92307, 92308, 92310, 92311, 92312, 92314, 92315, 92317, 92318, 92321, 92322, 92325, 92327, 92333, 92338, 92339, 92340, 92341, 92342, 92344, 92345, 92346, 92347, 92350, 92352, 92354, 92356, 92357, 92359, 92365, 92368, 92369, 92373, 92374, 92375, 92376, 92378, 92382, 92385, 92386, 92391, 92392, 92393, 92394, 92395, 92398, 92401, 92402, 92403, 92404, 92405, 92406, 92407, 92408, 92410, 92411, 92413, 92415, 92418, 92423, 92427
If your ZIP code is listed above, this report covers your water supply. Water quality may vary slightly by neighborhood.
Water Softener Sizing for San Bernardino
At 190 PPM (11.1 GPG), here is how to size a softener for your San Bernardino home. Multiply hardness in GPG (11.1) by daily water usage (roughly 50 gallons per person). A family of four uses about 200 gallons/day: 11.1 GPG × 200 gal = 2220 grains/day. Over a 7-day regeneration cycle, that is 15,540 grains - a 32,000-grain softener is the right fit for most San Bernardino households.
Compare San Bernardino to Other California Cities
Frequently Asked Questions About San Bernardino Water
Is San Bernardino tap water safe to drink?
Where does San Bernardino's water come from?
Do I need a water softener in San Bernardino?
Does San Bernardino water damage tankless water heaters?
How much does hard water cost a San Bernardino household per year?
What is the hardness of San Bernardino water in grains per gallon?
What size water softener do I need for San Bernardino?
Salt-based softener or salt-free conditioner for San Bernardino?
Data sources: Lead and copper data from EPA Safe Drinking Water Act LCR reporting. Contaminant data from utility-reported testing results. PFAS data from EPA UCMR5 (2023–2025). Hardness from USGS and municipal reports. Data reflects system-level testing results and may not match your specific tap due to neighborhood plumbing, season, or recent utility changes. For your utility's latest results, request their Consumer Confidence Report (CCR). Our methodology. Last updated: 2026-02-24.
What San Bernardino Homeowners Actually Buy
Common purchases for homes with 190 PPM water.
Affiliate disclosure: we may earn a commission. Selection based on San Bernardino's water data.