Is Bakersfield, CA Tap Water Safe to Drink?
Bakersfield tap water is legally compliant, but one contaminant exceeds health guidelines. Specifically: PFAS above EPA limits (PFOA: 6.53 ppt, PFOS: 6.75 ppt — limit is 4 ppt each). A point-of-use filter is recommended for drinking and cooking water. Bakersfield also has hard water at 132 PPM.
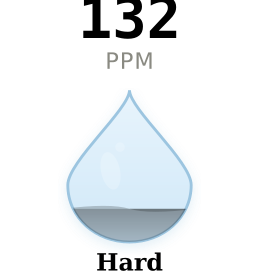
Hardness Scale: Where Bakersfield Falls
0Slightly
60Moderate
120Hard
180Very Hard
250Extreme
400+
How Bakersfield Compares
Bakersfield's water is close to the national average of 138 PPM, ranking #495 out of 1000 cities tracked. Within California, it ranks #70 of 87 cities (27% below the state average of 180 PPM). Among large cities (200k-500k), Bakersfield ranks #75 of 165 for hardness. At this hardness level, water heaters run an estimated 24% less efficiently due to scale insulation, and major water-using appliances typically last 2 years less than the national average lifespan.
What Bakersfield's Water Means for Your Home
Hardness: 132 PPM - Treatment Recommended
Bakersfield's water is hard at 132 PPM (7.7 GPG). That's enough to notice every day: gradual scale on fixtures, spots on dishes, soap that doesn't lather the way it should. That's 27% softer than the California average. Homeowners who install a water softener or salt-free conditioner notice the difference fast: better lathering, cleaner dishes, and appliances that last longer. That adds up. Hard water at 132 PPM increases household costs through scale-coated water heaters that use more energy, extra soap and detergent, and appliances that wear out faster. Most Bakersfield homeowners don't realize it until the plumber shows up.
Contaminants & Safety
Forever chemicals (PFAS) are worth watching here. Bakersfield has PFOA at 6.53 ppt and PFOS at 6.75 ppt, exceeding the EPA's 2024 limit of 4 ppt per compound. PFAS are synthetic compounds that accumulate in your body over time. A certified carbon filter or reverse osmosis system with NSF P473 certification is the most effective protection. See the regulatory timeline.
What's in the Treatment Process
Bakersfield's surface water supply requires heavy chlorination to stay safe — but that creates a tradeoff. The treatment process generates disinfection byproducts: TTHMs at 35.6 ppb (45% of the legal limit, but 237x the EWG guideline) and HAA5 at 36.3 ppb (61% of the legal limit, but 363x the EWG guideline). These are within legal limits, but the EWG sets much tighter thresholds based on cancer-risk research. A whole-house activated carbon filter reduces both chlorine and byproducts.
Chromium-6 was detected at 0.661 ppb, which is 33x the EWG health guideline. There's no separate federal limit for chromium-6, only total chromium. A reverse osmosis system is the most effective removal method. All measurements are within federal legal limits. The EWG guidelines represent a more conservative, health-based standard.
How Hard Water Affects Your Home
At 132 PPM, untreated hard water has measurable effects on household costs and appliance life:
- Water heater inefficiency: Scale insulation forces the heater to work harder (DOE estimates up to 22% more energy for heavily scaled units)
- Soap and detergent: Hard water reduces lathering, requiring significantly more product
- Appliance replacement: Water heaters, dishwashers, and washing machines fail 2-4 years earlier due to scale buildup
- Plumbing maintenance: Scale buildup in pipes reduces flow and requires more frequent service
Note: Impact varies by household size, water usage, and local energy costs. A home water test provides the most accurate assessment for your specific situation.
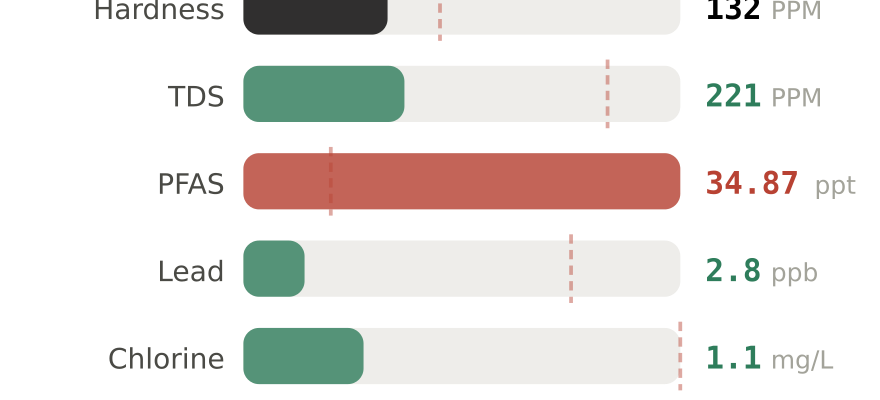
| Contaminant | Detected | Health Guideline | Legal Limit | Status |
|---|---|---|---|---|
| Hardness (as CaCO₃) | 132 PPM | < 60 PPM | No federal limit | ⚠ Hard |
| Total Dissolved Solids | 221 PPM | < 300 PPM | 500 PPM | ✓ OK |
| PFAS (total) | 34.87 ppt | — | No total limit | Detected |
| ↳ PFOA | 6.53 ppt | 0 ppt | 4 ppt (2024) | ⚠ Exceeds |
| ↳ PFOS | 6.75 ppt | 0 ppt | 4 ppt (2024) | ⚠ Exceeds |
| Lead | 2.8 ppb | 0 ppb (no safe level) | 15 ppb (10 ppb in 2027) | ✓ Low |
| Chlorine / Chloramine | 1.1 mg/L | Taste threshold ~1.0 | 4.0 mg/L | ✓ Normal |
| Nitrate | 1.87 mg/L | 5 mg/L | 10 mg/L | ✓ OK |
Recommendations for Bakersfield Homes
Our Top Picks for Bakersfield (132 PPM)
Hard water at 132 PPM causes scale buildup, increased energy use, and premature appliance failure. A softener protects your plumbing and appliances.
Recommended Filter for Bakersfield
PFAS exceed EPA limits (PFOA: 6.53 ppt, PFOS: 6.75 ppt — limit: 4 ppt each). A certified filter reduces these contaminants effectively.
Quick Fix for Chlorine: Shower Filter
At 1.1 mg/L chlorine, many Bakersfield residents notice dry skin, brittle hair, and that "pool smell" in the shower. A shower filter installs in 5 minutes, no tools needed.
How to Test Your Water in Bakersfield
With PFAS at 34.87 ppt in Bakersfield's supply, confirming your home's specific levels is especially important. PFAS vary by neighborhood and can concentrate differently depending on your position in the distribution system.
Free option: Request California Water Service's annual Consumer Confidence Report for official city-level data.
📊 Already Tested Your Water?
City averages miss neighborhood-level variation. Share your results to help your neighbors get better data.
We review every submission before publishing. Your ZIP is shown; your identity is not.
About Bakersfield's Water Supply
Water Utility: California Water Service
Water Source: Kern River, groundwater (Surface Water)
Population Served: 267,881
Hardness: 132 PPM (7.7 grains per gallon)
Bakersfield's drinking water comes from surface sources — Kern River, groundwater. Surface water requires more extensive treatment than groundwater, including coagulation, filtration, and disinfection. This heavier chlorination is why disinfection byproducts tend to be higher in surface-supplied systems. Despite the treatment process, mineral hardness from the watershed carries through. The system serves 268,000 residents.
Water quality can vary by neighborhood and season. For your exact numbers, request California Water Service's Consumer Confidence Report (CCR) or test your own tap.
ZIP Codes Covered by This Report
This water quality data applies to all areas served by California Water Service in Bakersfield, CA, including ZIP codes:
93203, 93205, 93206, 93207, 93215, 93216, 93218, 93220, 93222, 93224, 93225, 93226, 93238, 93240, 93241, 93243, 93249, 93250, 93251, 93252, 93255, 93260, 93261, 93263, 93268, 93276, 93280, 93283, 93285, 93287, 93301, 93302, 93303, 93304, 93305, 93306, 93307, 93308, 93309, 93311, 93312, 93313, 93314, 93380, 93383, 93384, 93385, 93386, 93387, 93388, 93389, 93390, 93518, 93527, 93531, 93542
If your ZIP code is listed above, this report covers your water supply. Water quality may vary slightly by neighborhood.
Water Softener Sizing for Bakersfield
At 132 PPM (7.7 GPG), here is how to size a softener for your Bakersfield home. Multiply hardness in GPG (7.7) by daily water usage (roughly 50 gallons per person). A family of four uses about 200 gallons/day: 7.7 GPG × 200 gal = 1540 grains/day. Over a 7-day regeneration cycle, that is 10,780 grains - a 32,000-grain softener is the right fit for most Bakersfield households.
Compare Bakersfield to Other California Cities
Frequently Asked Questions About Bakersfield Water
Is Bakersfield tap water safe to drink?
Where does Bakersfield's water come from?
Do I need a water softener in Bakersfield?
How do I remove PFAS from Bakersfield tap water?
What water filter is best for Bakersfield?
Is Bakersfield water safe for babies and infants?
Does Bakersfield water damage tankless water heaters?
Do I need both a softener AND a filter in Bakersfield?
Data sources: Lead and copper data from EPA Safe Drinking Water Act LCR reporting. Contaminant data from utility-reported testing results. PFAS data from EPA UCMR5 (2023–2025). Hardness from USGS and municipal reports. Data reflects system-level testing results and may not match your specific tap due to neighborhood plumbing, season, or recent utility changes. For your utility's latest results, request their Consumer Confidence Report (CCR). Our methodology. Last updated: 2026-02-24.
What Bakersfield Homeowners Actually Buy
Prioritized for contaminant reduction for homes with 132 PPM water and PFAS above EPA limits.
Affiliate disclosure: we may earn a commission. Selection based on Bakersfield's water data.